 Skip to content
About This Article
Written by: Apex Brain & Hearing Health Editorial Team
Developed using reputable medical literature, clinical guidance, and trusted health organizations whenever appropriate.
Affiliate Disclosure: Apex Brain & Hearing Health may earn a commission if you purchase through links on this page, at no additional cost to you. As an Amazon Associate, we earn from qualifying purchases. Learn more.
What Is an Audiogram and How Do You Read One?
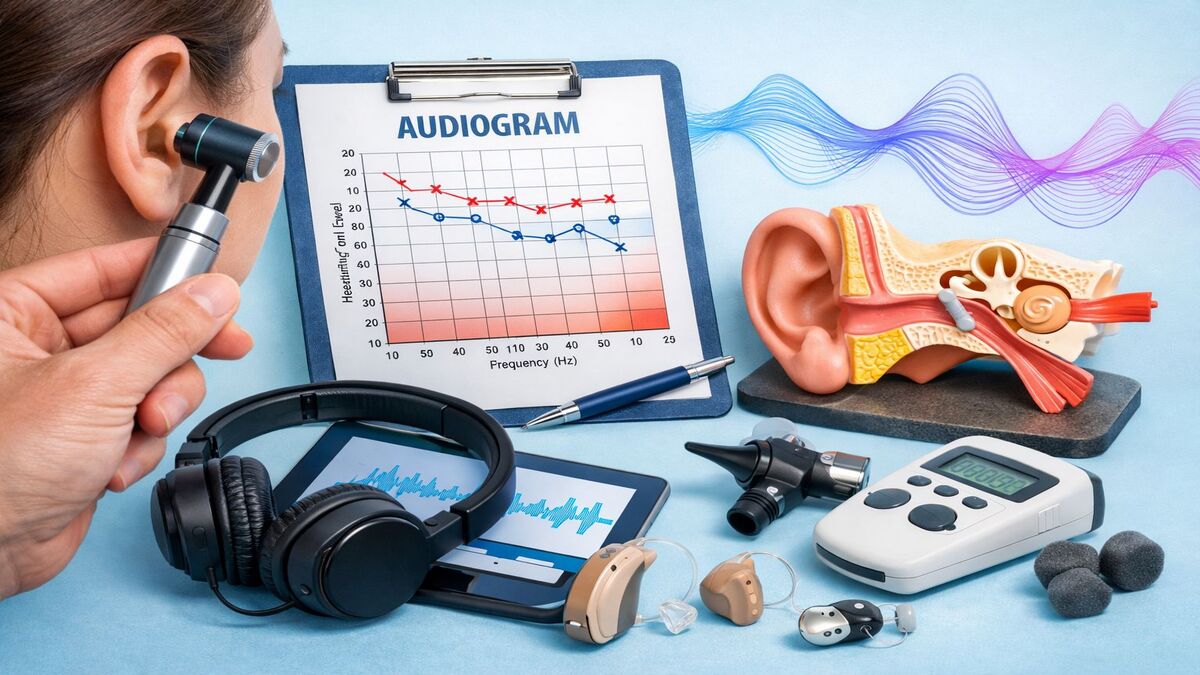
An audiogram is a graph that shows the quietest sounds a person can hear at different pitches. It is created during a hearing test called pure-tone audiometry and helps an audiologist identify the degree, type, and pattern of hearing loss.
To read an audiogram, look at the frequencies in hertz (Hz) across the horizontal axis and hearing levels in decibels hearing level (dB HL) down the vertical axis. Marks near the top indicate better hearing sensitivity. Marks lower on the graph mean the sound had to be louder before it could be heard.
Symbols identify which ear was tested and whether sound was presented through earphones or a bone-conduction device.
The key point: An audiogram shows how softly you can detect different tones. It does not, by itself, show exactly how well you understand conversations or determine the cause of hearing loss.
How to Read an Audiogram in 5 Steps
You can understand the basic information on most conventional audiograms by following five steps.
- Read the horizontal axis: Frequencies move from low pitches on the left to high pitches on the right.
- Read the vertical axis: Hearing levels are measured in dB HL. Lower plotted points indicate poorer hearing sensitivity.
- Identify each ear: A red O usually represents the right ear, while a blue X usually represents the left ear during unmasked air-conduction testing.
- Examine the pattern: Look for relatively flat thresholds, downward slopes, upward slopes, or dips at certain frequencies.
- Compare air and bone conduction: Differences between these measurements can help identify conductive, sensorineural, or mixed hearing loss.
After reviewing these features, ask your audiologist to explain how the findings relate to your speech understanding and everyday communication needs.
What Do the Numbers on an Audiogram Mean?
An audiogram uses two axes to display hearing sensitivity.
Horizontal Axis: Frequency in Hertz (Hz)
The horizontal axis represents sound frequency, which determines pitch.
Lower-frequency sounds appear toward the left of the graph, while higher-frequency sounds appear toward the right.
Common test frequencies include:
- 250 Hz: Lower-pitched sounds
- 500 Hz: Low-to-middle-frequency sounds
- 1,000 Hz: Middle-frequency sounds
- 2,000 Hz: Middle-to-higher-frequency sounds
- 4,000 Hz: Higher-frequency sounds
- 8,000 Hz: High-frequency sounds
Some hearing evaluations also include additional frequencies, such as 125, 3,000, or 6,000 Hz.
Standard testing commonly covers frequencies from approximately 250 to 8,000 Hz, although the exact range depends on the evaluation.
Speech contains information across a broad range of frequencies, so the particular frequencies affected can influence which parts of conversation are difficult to understand.
Vertical Axis: Hearing Level in Decibels (dB HL)
The vertical axis shows hearing thresholds measured in decibels hearing level, abbreviated dB HL.
The numbers generally increase as you move downward.
A point at 10 dB HL means the person detected a relatively soft test tone at that frequency.
A point at 60 dB HL means the tone needed to be presented at a substantially higher hearing level before it was detected.
This is why an audiogram can appear upside down compared with other graphs: lower plotted points mean poorer hearing sensitivity.
Important: Decibels hearing level (dB HL) are not directly equivalent to the decibel measurements commonly used for environmental sounds, such as dB SPL or dBA.
For example, a hearing threshold of 60 dB HL should not be interpreted as meaning someone can only hear environmental sounds louder than 60 dBA.
What Do the O, X, and Bracket Symbols Mean?
Audiologists use standardized symbols to identify the tested ear, how sound was delivered, and whether masking was used.
The most common symbols are:
- O: Right-ear air-conduction threshold, usually without masking
- X: Left-ear air-conduction threshold, usually without masking
- <: Right-ear bone-conduction threshold, unmasked
- >: Left-ear bone-conduction threshold, unmasked
- [: Right-ear bone-conduction threshold with masking
- ]: Left-ear bone-conduction threshold with masking
Other symbols, including triangles and squares, may represent masked air-conduction results.
Red is conventionally used for the right ear and blue for the left ear, but the symbol key on the actual report should always be checked.
Audiograms may show both ears on the same graph or display each ear separately.
See the ASHA Guidelines for Audiometric Symbols for the standardized notation system.
What Is Masking During a Hearing Test?
Masking is a testing technique used when sound presented to one ear might also be detected by the other ear.
The audiologist may present noise to the nontest ear while measuring the hearing threshold of the ear being tested.
This helps establish more reliable ear-specific results.
Masked and unmasked symbols may look different, so reviewing the report’s legend is important.
What Is Considered Normal Hearing on an Audiogram?
Different professional classification systems use slightly different boundaries for normal hearing sensitivity.
One commonly used ASHA classification identifies the following degrees of hearing loss:
- Normal: -10 to 15 dB HL
- Slight: 16 to 25 dB HL
- Mild: 26 to 40 dB HL
- Moderate: 41 to 55 dB HL
- Moderately severe: 56 to 70 dB HL
- Severe: 71 to 90 dB HL
- Profound: 91 dB HL or greater
Some adult clinical settings use 20 or 25 dB HL as the upper limit of normal hearing sensitivity.
Children may require different interpretation because even relatively small changes in hearing can affect access to important speech sounds during learning and development.
These categories describe hearing thresholds. They do not independently determine how well someone understands speech or how much difficulty they experience in daily life.
Source: ASHA: Type, Degree, and Configuration of Hearing Loss.
How Do You Interpret an Audiogram Result?
Consider a hypothetical audiogram with the following right-ear air-conduction thresholds:
- 250 Hz: 15 dB HL
- 500 Hz: 15 dB HL
- 1,000 Hz: 20 dB HL
- 2,000 Hz: 30 dB HL
- 4,000 Hz: 50 dB HL
- 8,000 Hz: 60 dB HL
In this example, the hearing thresholds are relatively good at lower frequencies but become progressively poorer at higher frequencies.
The plotted points would create a downward-sloping pattern toward the right side of the audiogram.
This pattern could make higher-frequency speech information more difficult to hear, including certain consonants.
However, the graph alone would not establish whether aging, noise exposure, genetics, or another condition caused the hearing loss.
The audiologist would also review the opposite ear, bone-conduction findings, speech testing, and medical history.
What Do Different Audiogram Shapes Mean?
The overall shape of an audiogram is called its configuration.
Several configurations are commonly recognized.
Downward-Sloping Hearing Loss
A downward-sloping audiogram indicates that hearing thresholds become poorer at higher frequencies.
This configuration is often associated with age-related or noise-induced hearing loss.
However, the shape alone cannot identify the cause.
Flat Hearing Loss
A flat audiogram indicates that hearing thresholds are relatively similar across the measured frequencies.
This does not necessarily mean hearing is normal.
For example, thresholds consistently around 50 dB HL would represent a relatively flat pattern of hearing loss.
Rising Hearing Loss
A rising audiogram shows poorer hearing thresholds at lower frequencies and better thresholds at higher frequencies.
This configuration may occur with selected inner-ear or other hearing conditions.
Additional assessment is needed to determine the cause.
U-Shaped or Cookie-Bite Hearing Loss
A U-shaped audiogram shows poorer hearing thresholds in the middle frequencies than at lower and higher frequencies.
This pattern is sometimes called cookie-bite hearing loss.
Some inherited conditions are associated with this configuration, although the audiogram shape alone does not establish a genetic diagnosis.
Notched Hearing Loss
A notch is a localized area of poorer hearing thresholds, often involving higher frequencies.
Some noise-induced hearing loss patterns show a notch around 3,000, 4,000, or 6,000 Hz.
However, a notch does not automatically prove that noise exposure caused the hearing loss.
What Is the Speech Banana on an Audiogram?
The speech banana is an educational illustration showing the approximate frequency and intensity regions where different speech sounds commonly occur.
It gets its name from the curved, banana-like region drawn on some audiograms.
Lower-frequency vowel information often appears toward one side, while important higher-frequency consonant information appears farther toward the other.
Some speech sounds may be harder to detect when hearing thresholds are poorer in the frequencies containing important speech cues.
However, the speech banana is only an approximation.
Actual speech levels vary with the speaker, distance, speaking effort, acoustic environment, and other factors.
The speech banana is not a diagnostic test. It cannot independently predict how well someone will understand conversations or whether hearing aids are needed.
What Is the Difference Between Air Conduction and Bone Conduction?
Air-conduction and bone-conduction testing help audiologists distinguish different types of hearing loss.
Air-Conduction Testing
During air-conduction testing, sound travels through the outer ear, middle ear, and inner ear.
Testing is usually performed using headphones or insert earphones.
The results reflect hearing sensitivity across the auditory pathway used during ordinary sound transmission.
Bone-Conduction Testing
During bone-conduction testing, a small vibrator transmits sound through the skull, largely bypassing the outer and middle ear.
This helps evaluate the function of the cochlea and subsequent auditory pathways without relying on ordinary outer- and middle-ear sound conduction.
Because bone-conducted sound can stimulate both inner ears, masking may be needed to identify which ear is responding.
What Is an Air-Bone Gap?
An air-bone gap is a difference between air-conduction and bone-conduction thresholds at the same test frequency.
When air-conduction thresholds are substantially poorer than bone-conduction thresholds, a conductive component may be present.
For example:
- Air-conduction threshold: 50 dB HL
- Bone-conduction threshold: 15 dB HL
- Air-bone gap: 35 dB
In this hypothetical example, the difference suggests that sound transmission through the outer or middle ear may be contributing to hearing loss.
The audiologist must interpret the findings alongside masking results, middle-ear testing, and other clinical information.
An air-bone gap does not independently establish a particular medical diagnosis.
How Does an Audiogram Show the Type of Hearing Loss?
Comparing air-conduction and bone-conduction thresholds can help distinguish three broad hearing-loss types.
Conductive Hearing Loss
Conductive hearing loss typically produces poorer air-conduction thresholds while bone-conduction thresholds remain relatively better.
An air-bone gap is usually present.
Possible causes include earwax blockage, middle-ear fluid, and other outer- or middle-ear conditions.
Sensorineural Hearing Loss
Sensorineural hearing loss generally produces similar air-conduction and bone-conduction thresholds, without a clinically significant air-bone gap.
It involves the inner ear or auditory nerve.
Common contributors include aging, noise exposure, certain medications, and some medical conditions.
Mixed Hearing Loss
Mixed hearing loss combines conductive and sensorineural components.
Both air-conduction and bone-conduction thresholds are elevated, with an additional air-bone gap.
Management may need to address both components separately.
Why Are Right-Ear and Left-Ear Results Compared?
Audiologists test each ear separately because hearing loss may affect the ears differently.
Some people have relatively symmetrical hearing thresholds, meaning both ears have similar results.
Others have asymmetrical hearing loss, where one ear has substantially poorer hearing sensitivity.
Unexplained asymmetry can warrant additional medical evaluation.
The audiologist considers differences between ears alongside symptoms, tinnitus, dizziness, medical history, and other findings.
An asymmetrical audiogram does not automatically mean a serious condition is present, but it should not be dismissed without appropriate assessment.
What Do Speech Reception and Word Recognition Scores Mean?
Many comprehensive hearing reports include speech testing in addition to the pure-tone audiogram.
These results provide information that the plotted tone thresholds cannot fully describe.
Speech Reception Threshold (SRT)
The speech reception threshold is commonly defined as the lowest presentation level at which someone can correctly recognize approximately 50% of familiar two-syllable words used in the test.
The result is usually reported in dB HL.
Audiologists compare speech reception thresholds with pure-tone findings to help assess consistency.
Word Recognition Score (WRS)
Word recognition testing measures how accurately someone identifies spoken words presented under specified listening conditions.
Results are often reported as a percentage.
For example, a score of 80% may mean the listener correctly repeated 40 of 50 test words at the particular presentation level used.
However, a word recognition score depends on the test material, presentation level, language, and testing method.
It should not be interpreted as the percentage of ordinary conversation someone understands in everyday life.
Speech-in-Noise Testing
Speech-in-noise testing evaluates how well someone understands speech when competing sound is present.
It can provide useful information when the person reports difficulty in restaurants, group conversations, or other noisy environments.
These tests complement the audiogram rather than replacing it.
Can You Have a Normal Audiogram and Still Struggle to Hear?
Yes. Conventional pure-tone testing measures hearing sensitivity at specific frequencies in a controlled environment.
It does not fully assess every aspect of speech perception, attention, language, and auditory processing.
Some people experience significant difficulty understanding speech in noise despite normal conventional hearing thresholds.
Possible explanations vary and may include difficulties not captured by standard testing.
A normal audiogram does not automatically establish an auditory processing disorder.
Further assessment, such as speech-in-noise testing, may help characterize the problem.
For a related discussion, read our article on auditory processing disorder (APD).
Does an Audiogram Tell You Whether You Need Hearing Aids?
An audiogram is important when evaluating hearing-aid options, but it does not make the decision by itself.
An audiologist also considers:
- The degree and configuration of hearing loss
- Speech recognition performance
- Communication difficulties in everyday life
- Hearing levels in each ear
- Medical conditions affecting the ears
- Personal communication goals
- Device eligibility, preferences, and practical limitations
Some people with mild hearing loss benefit from amplification, while others may initially focus on monitoring or communication strategies.
Modern hearing aids can be programmed using audiometric results to provide appropriate frequency-specific amplification.
However, they do not repair damaged inner-ear structures or guarantee normal hearing.
When Should You Have Another Hearing Test?
The appropriate follow-up schedule depends on your hearing results, symptoms, age, medical history, and risk factors.
An audiologist may recommend repeat testing to monitor changes or assess the effectiveness of treatment.
Seek a hearing evaluation if you experience new difficulties understanding conversations, changes in tinnitus, or increased difficulty hearing certain sounds.
For additional guidance, see our article on early warning signs of cognitive and hearing changes.
Important: Sudden hearing loss in one or both ears requires urgent medical evaluation, preferably the same day. Do not assume sudden hearing changes are caused by earwax or congestion without assessment.
Questions to Ask Your Audiologist About Your Audiogram
If you receive a copy of your hearing-test results, consider asking:
- What degree of hearing loss do I have in each ear?
- Which frequencies are most affected?
- Are the results symmetrical or asymmetrical?
- Do the air- and bone-conduction results suggest conductive, sensorineural, or mixed hearing loss?
- How did I perform on speech recognition testing?
- Does my hearing pattern suggest a need for medical evaluation?
- Would hearing aids or assistive technology be appropriate?
- When should my hearing be tested again?
These questions can help connect the graph with your everyday communication needs.
Frequently Asked Questions
What does an audiogram measure?
An audiogram displays hearing thresholds at different frequencies. It shows how soft a tone can be before the person can no longer detect it reliably.
What does 40 dB HL mean on an audiogram?
It means the listener’s hearing threshold at that frequency was measured at 40 decibels hearing level. The result must be interpreted in relation to the specific frequency and the rest of the hearing assessment.
Is a higher audiogram number worse?
Generally, yes. A higher dB HL threshold means a louder test tone was needed for detection. On a conventional audiogram, higher threshold numbers appear lower on the graph.
What does a red O mean on an audiogram?
A red O typically represents an unmasked air-conduction hearing threshold for the right ear.
What does a blue X mean on an audiogram?
A blue X typically represents an unmasked air-conduction hearing threshold for the left ear.
What does a downward slope mean?
A downward slope toward higher frequencies indicates poorer high-frequency hearing sensitivity. This pattern is common in age-related and noise-induced hearing loss but does not establish the cause by itself.
Can an audiogram diagnose tinnitus?
No. An audiogram measures hearing thresholds. It can identify hearing loss that may occur alongside tinnitus, but tinnitus is evaluated through symptoms, history, and other appropriate assessments.
Can an audiogram show auditory processing disorder?
No. A pure-tone audiogram does not diagnose auditory processing disorder. Additional testing may be appropriate when listening difficulties are not adequately explained by conventional hearing thresholds.
Can a child have an audiogram?
Yes. Children can undergo age-appropriate hearing evaluations. Testing methods vary by developmental stage and may include behavioral audiometry or physiological measurements.
Does a normal audiogram mean hearing is perfect?
No. Normal thresholds at the tested frequencies indicate that basic hearing sensitivity is within the expected range under the testing conditions. They do not measure every aspect of hearing or guarantee normal speech understanding in background noise.
The Bottom Line
An audiogram is a graph showing hearing sensitivity across different frequencies.
To understand it, read frequency from left to right, hearing thresholds from top to bottom, identify the symbols for each ear, and examine the pattern of air- and bone-conduction results.
The graph can reveal the degree and configuration of hearing loss and help distinguish conductive, sensorineural, and mixed components.
However, an audiogram is only one part of a comprehensive hearing evaluation. Speech testing, symptoms, and medical findings help determine what the results mean for everyday communication and treatment.
If you are unsure what your audiogram shows, ask your audiologist to explain the findings for each ear and how they relate to your hearing needs.
Medical Disclaimer
Apex Brain & Hearing Health provides educational information only. Our content is not a substitute for professional medical advice, diagnosis, or treatment.
Always seek the advice of a qualified healthcare professional with questions about a medical condition, symptoms, treatment options, or changes to your health.


